Impact Series is a series that highlights and expands on statistics that we don’t get to explore or celebrate in our national reports. These posts will give more insight into our data collection and our results. For previous posts, explore the Impact Series tag.
Springboard families attend 90% of family workshops. Yes, that’s right, I said 90%.
When I share this stat, people react in one of two ways: most are impressed; some are immediately skeptical. The skeptics often ask the same questions: “Do you mean that 90% of people attend just one workshop?” and “What kind of schools do you work at, anyway?”
Teachers and leaders who struggle to get even half of their students’ families through the door at back-to-school nights and report card conferences are understandably hesitant to believe that families show up for 90% of Springboard’s workshops.
But they do.
Before we get into the “how” behind this outrageously high percentage, let’s get a little nerdy and make sure we understand exactly what that 90% really means.
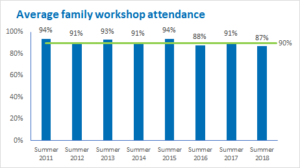
Each summer, Springboard hosts 5 family workshops at every school. Between 2011 and 2018, Springboard averaged 90% family workshop attendance nationally (see the graph for the details by year!). We reach this number by calculating the average attendance percentage for each family member. So for example, if Jayden’s family attends 4 out 5 workshops (80%) and Angel’s family attends 5 out of 5 workshops (100%), the combined average workshop attendance for the two families would be 90%.
If I take Jayden’s family, Angel’s family, and the other 16,333 families who have participated in Springboard over the past eight summers, the average family workshop attendance is 90%.
But what does this look like during any given summer? In Summer 2017, the average Springboard family member attended 4.5 out of 5 workshops offered (an average of 91% attendance overall). In Summer 2018, the average Springboard family member attended 4.3 out of 5 workshops offered (an average of 87% overall).
Most recently in Summer 2018, this amounted to 94% of families attending at least one workshop and a whopping 76% of families attending all 5 workshops.
In other words, Springboard families consistently see our workshop curriculum through, from start to finish.
So who are Springboard families? Do they have an unusual amount of free time? Are they from schools with particularly strong family engagement cultures? Maybe a few lucky ones fit these criteria, but for the most part, we don’t think so.
Although here at Springboard, we think (or actually, we know) that our families are above average, we also don’t have reason to believe that Springboard families start the program with any more time or resources than the average American parent. In fact, we specifically seek out districts where the majority of scholars experience socioeconomic disadvantage, so you might expect that Springboard families actually have less time to take away from work and home to devote to school events.
Research shows that families experiencing poverty and families who identify as Black or Latino are less likely to participate in school-related activities (1). In Summer 2018, about 90% of Springboard scholars were eligible for free or reduced lunch and about 88% of Springboard scholars were Black or Latino, so it’s likely that, if anything, Springboard families came into the program with below-average participation in school events.
We are particularly proud of our high workshop attendance because we know it was hard won by the teachers and leaders at each Springboard school.
It’s not easy to plan and advertise a family event, get busy family members to show up, and then leave attendees satisfied that the event was a good use of their time.
We also hope that our high family attendance rates demonstrate that there is no such thing as an “unreachable” family. At Springboard, we are consistently floored by the lengths that families go to so that they are able to “show up” for their children. If during the course of a 5-week summer program, we can get nearly every family through the door, then we know that you and your school community can do the same during the school year!
(1) McQuiggan, M. & Megra, M. (2017). Parent and family involvement in education: Results from the National Household Education Surveys Program of 2016 (NCES 2017-102) [Table 2], Washington, DC: U.S. Department of Education, National Center for Education Statistics. Retrieved from https://nces.ed.gov/pubs2017/2017102.pdf.

Truly impressive statistic! The families must find the workshops very helpful.
This is a great explanation to a stunning statistic, which can often seem misleading or, worse, suspect. We need more of you to explain the rest of the world!